Mobile App Marketing – A guide to the main KPIs (Part 1)
Nowadays, people spend on average 5 hours per day on their smartphones and 2 hours per day using apps.
In 2018, on average:
- 80 apps are installed on each mobile device.
- The annual mobile app expenditure rose by 150%.
- The annual mobile app downloads rose by 60%.
- More than 40 billions of apps have been downloaded.
As stats point out, mobile app marketing is one of the most profitable business in the industry, so how can you find out whether or not your mobile app business is doing well?
Data is the answer.
Tracking and analyzing metrics can help you understand if your app is profitable, how people are interacting with it and even how to optimize and improve your overall performance.
This series will cover two main types of metrics, app usage & engagement and profitability metrics, to help you understanding and measuring them.
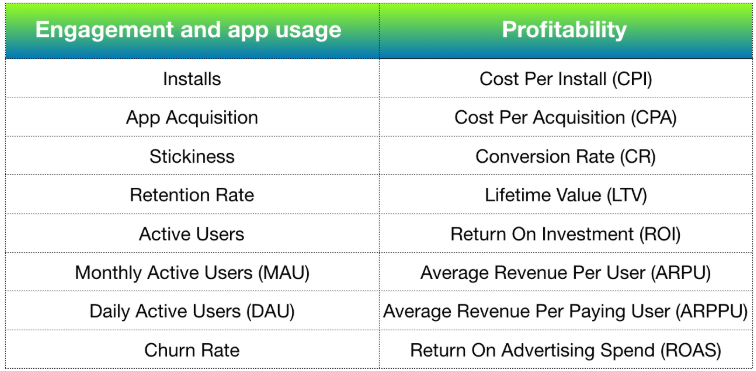
Engagement and app usage metrics
1. Installs
Installs give you an idea of how many people have downloaded your app. This metric alone doesn’t give you any information about the actual success or failure of your business. For example, users could’ve installed your app and use it once or uninstalled it right away. Nevertheless, while dealing with metrics installs are important because they are the foundation for many other metrics.
How to track installs:
You can easily track installs by using Google Analytics.
2. App Acquisition
Installs tell you how many people have downloaded your app, but they do not give you any information about where those installs are coming from. App acquisition uncovers the effectiveness of various marketing channels in order to identify the top performing ones, getting the most out of your marketing budget.
How to track app acquisition:
App acquisition can be easily tracked through Google Analytics or through platforms that allow tracking campaign source for app installs events as Mixpanel, Branch Metrics, Adjust, Kochava or AppsFlyer.
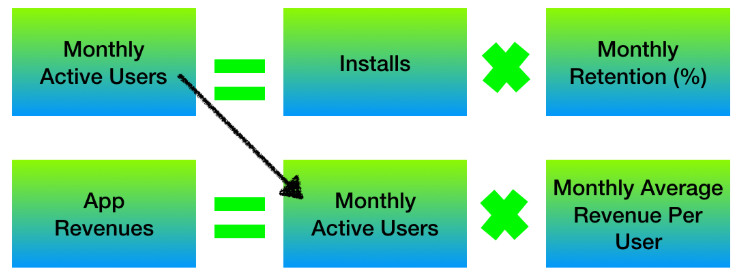
3. Active Users – DAU and MAU
Active users are pure gold dust for mobile marketers, who spend time trying to identify the best users for their app across different networks. When dealing with mobile marketing, it is essential to understand the difference between people who are simply downloading an app and active users. Active users are those that have downloaded an app and regularly engage with it. Not all people will download your app will be active users.
When a user can be classified as active? The definition of an active user is quite broad since it comprises all those people who have been interacting with a business over a specified period of time. According to Google Analytics classification, an active user is a user who has opened and interacted with you within the last 30 days.
Active users can be divided into Daily Active Users (DAU) and Monthly Active Users (MAU).
4. Daily Active Users – DAU
Daily active users are the total amount of users who visit your app on a daily basis. It measures the level of engagement your retained users show during the day and how immersed they are in the app itself.
In order to measure DAU, you have to outline which are the actions that will define the level of engagement (i.e registration, sign-in, completed check out, add an item to the cart, number of game sessions).
Simplifying,
DAU= # USERS WHO OPENED YOUR APP IN A DAY
5. Monthly Active Users – MAU
Monthly active users are the total amount of users who visit your app within a 30 days’ period.
MAU= # USERS WHO OPENED YOUR APP IN A MONTH
On average,
How to track DAU and MAU:
You can track the number of your daily and monthly active users using various analytic tools (as those mentioned above).
In Google Analytics, the active user report can be found under the Audience menu. Through the active users report you can determine how many users have interacted with your app in the/over the selected time period and compare the number of active users in different time periods (i.e 1 day and 7 days).
4. Stickiness
Stickiness is the ratio between your DAU and MAU and it shows how often users return to use your app. The higher the stickiness, the more engaging is your app.
STICKINESS= (DAU/MAU)*100
According to some recent researches, the average app loses 77% of its daily active users (DAUs) within the first three days after the install. There are 5 “secrets” you can use to increase stickiness:
- Problem – what real problems are your end-users having and how can you fix them?
- Onboarding – onboarding sets the tone for the relationship between you and the end-user, forming habits. A bug during onboarding means you could lose users forever.
- Features – in order to come back, people need a good reason. Adding new features to your app on a regular basis will help you re-engage users and keep them from losing interest.
- Power users – power users are those who are finding the most value in your app. Once you know who your power users are, it’s important to understand how they are using your app, finding out what keeps them coming back. This is essential to develop new features and to expand your audience.
- Loyalty – a rich user experience, clean design and intuitive navigation will make your app easy and enjoyable to use. A satisfied user will likely turn into a loyal customer.
5. Retention Rate
Retention is the ability of a company or product to retain people over a well-defined period. App retention rate measures how many users return to your app after previously using it at another time. On average, app retention rate after one month is around 45% and it decreases to 32% after 3 months.
APP RETENTION RATE= (NUMBER OF USERS RETAINED AT THE END OF TIME PERIOD/ NUMBER OF USERS AT START OF THE TIME PERIOD) *100
People get bored easily; keeping users engaged with your app is one of the most difficult things ever. Retention rate can be useful for several reasons:
- it can be an indicator of your app success or failure
- it can give you insights on your current customer base. How they are reacting to new features? How they behave?
- it can be used to calculate your revenues
How to track retention:
You can easily track retention by using Google Analytics (The Cohort Analysis Report)
 6. Churn Rate
Churn rate is the opposite of retention rate, it tells you how many people stopped using your app within a particular timeframe. In a successful app business churn rate is way lower than the growth rate. On average, app churn rate after one month is around 55% and it decreases to 68% after 3 months.
APP CHURN RATE = 1 – RETENTION RATE
There are several reasons for ditching an app:
- Complicated sign-up
- Too many push notifications
- Battery drains
- Unjustified permission requests
- Unexpected app quits
You should monitor these things, collect feedback and fix any potential churn trigger as soon as you face them: the longer you keep users onboard, the higher your revenues will be.
How to track churn rate:
To track churn rate you can use the Cohort Analysis Report mentioned above.
Wrapping up:
At first glance, going through mobile analytics seems quite easy. What you really have to understand is what you are looking for. Before diving into data and metrics you really need to identify your goals and question yourself whether or not you need that specific metric. Remember, metrics are meaningful only if related to a set goal so do not waste time on those you don’t need.
Wanna know more about mobile app metrics? Stay tuned for the second part 😉
Sources: Localytics, Google Analytics, Adjust