Mobile App Marketing – A guide to the main KPIs (part 2)

In the first part of this series, we have seen the main usage and engagement metrics you should use to evaluate if your app is doing well. The success of an app business consists of two elements: how much you can keep users engaged and how many money you can make with your app.
Profitability metrics allow tracking how many money are you making with your app.
Profitability Metrics
Cost per Install (CPI)
Cost per install is one of the primary metrics by which marketers measure their advertising budget, and it is strictly related to the concept of performance. In a cost per install campaign, publishers place digital ads across a range of media to drive installation of the advertised application. The brand is charged a fixed or bid rate only when the application is installed.
The advertiser will pay the publisher only if the app is installed instead of spending just for the ad being viewed (as in a CPM model): this makes sure that publishers place the ad where conversion rates are high, targeting the fittest audience.

CPI rates depend on countries, platforms and verticals.
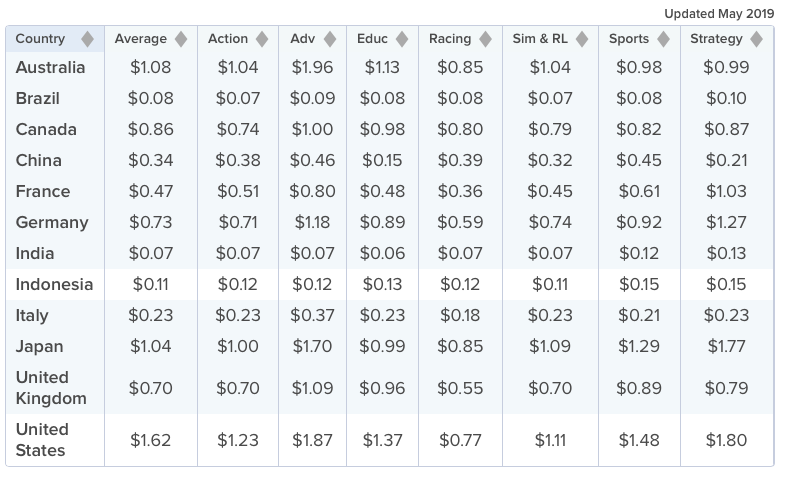
CPI rates for Android – gaming. Source: Chartboost
Cost per acquisition (CPA)
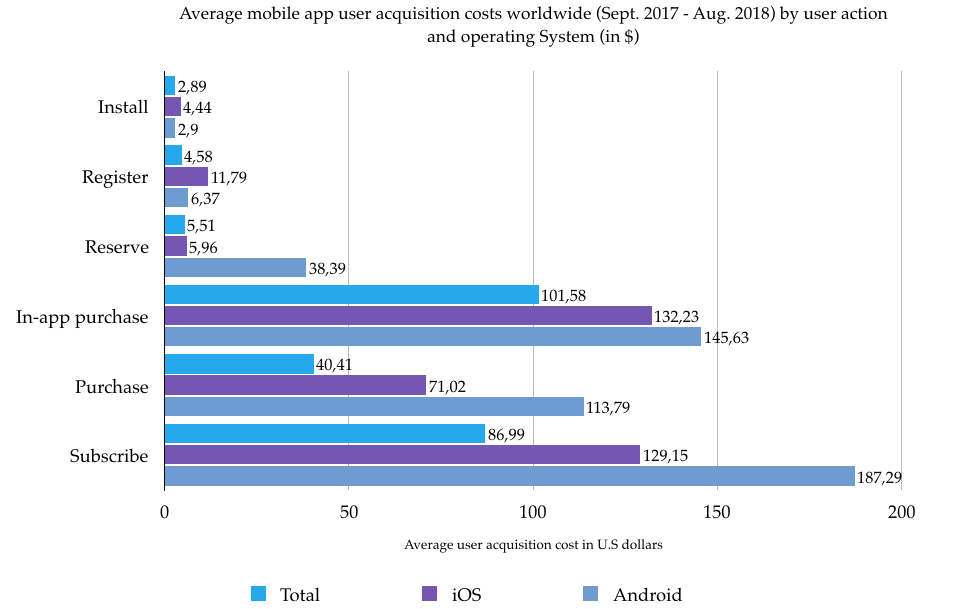
The total number of installs is not enough to tell you how well or bad your app is performing. To evaluate the success of your app business, you need to understand how much acquiring new users costs. Cost per acquisition (also known as cost per action) is defined as the price brands pay for a specified acquisition/action (i.e. purchases, clicks, form submission etc). CPA tells you how much each user costs you.

Conversion Rate (CR)
Conversion rate is defined as one of the golden mobile marketing metrics. It allows understanding how many of the users who discovered an app through an ad actually installed it, measuring the effectiveness of user acquisition efforts. Conversion rates go far beyond downloads: it is the percentage of users who complete a desired action or interaction.
Simplifying,

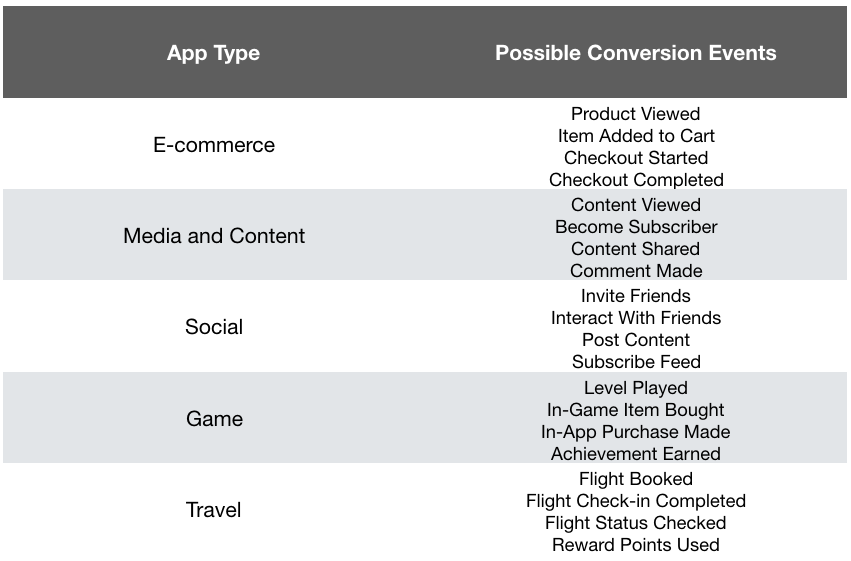
App Type and Conversion Goal
When dealing with app conversion rates, many people distinguish between App Page Conversion Rate and App Store Search Conversion Rate.
App Store Search Conversion Rate tells you how your app stands out in the app store search results. It is defined as the percentage of users that download your app directly from the app store search or browse results, without tapping through to your app page. The average app store search conversion rate in the Apple App Store in the US is 2,42%.
App Page Conversion Rate gives you an idea of how your app page convinces users to install your app once they have tapped through or viewed your page. It is defined as the percentage of users that download your app after they have seen your app page. The average app page conversion rate in the Apple App Store in the USA is 25,25%, while in Google Play Store it rises to 27,76%.
Lifetime Value (LTV)
Lifetime value is one of the most important metrics to measure at any growing company. It identifies how much value each customer brings to your app over a specific period.
LTV should always be higher than CPA. If it isn’t, it probably means you are paying too much for acquiring your users. The intricate part about LTV is the fact there isn’t a unique formula to compute it: each business adds in variables in order to have a final result that actually makes sense for the company itself.
Here are two ways to track LTV:

Or

Being able to track LTV is it essential for various reasons:
- it tells brands how much revenue one customer can generate during their business relationship. The longer the relationship, the greater the customer lifetime value becomes.
- it measures the effectiveness of marketing efforts in term of user acquisition
- it sets a limit on how much brands can afford to acquire one single user.
Return On Investment (ROI)
Everyone wants to know how much money he can make with his mobile app, but only a few can get it right. Return on investment is defined as a performance measure used to evaluate the efficiency of an investment or compare the effectiveness of several different investments. It measures the money you can make on the money you have spent building and marketing your app.
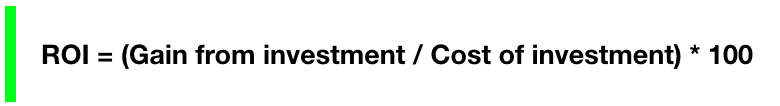
To calculate ROI, you need to identify how much you have invested in your user acquisition campaigns, meaning not only the direct campaign funding but an entire series of parameters as paid automation tools, design tools, team salaries etc.
To track ROI,
Average Revenue Per User (ARPU)
Often, people tend to confuse LTV with ARPU. While they are related, they are different metrics. The Average Revenue Per User tells you the value a single user has generated since the launch of your app.

Or

LTV measures the value, on average, of a customer that signs up to your product or download your app.
LTV = (Lifetime spend – lifetime variable costs) / # of customers acquired
Lifetime measures how profitable your users are on a unit basis, while ARPU is a way to measure the overall health of your business on an ongoing basis.
There are several reasons why ARPU is essential to your business:
- comparing to competitors and companies in other verticals
- choosing the right user acquisition channel
- segmenting users
- forecasting
Average Revenue Per Paying User (ARPPU)
By the same token, the Average Revenue Per Paying User is defined as the value single paying user has generated since the launch of your app.

Return On Advertising Spend (ROAS)
In a rapidly evolving landscape as the mobile marketing one, marketers need a more robust metric to measure the profitability of their business. When it comes to marketing their apps, they need a metric that tells them they are making the best decision ever, maximizing profits while minimizing costs. Return on investment measures your ad spend against the results it produces.
It can be defined as “the actual profit that a company/advertiser makes based on the advertising of the product or service they are promoting. This can also be viewed as the amount of money that the company earns versus the amount that is spent on their advertising campaign.”

Or

ROAS permits you to allocate your advertising budget with confidence:
- if ROAS is positive – meaning profits from ad campaign > ad spend – continue investing
- if ROAS is negative – meaning ad spend > profits from ad campaign – change your budget allocation.

ARPU – Source: Apptentive
ROAS also allows you to compare the anticipated returns of different ad networks possible.
Conclusions
Data analysis is an essential part of any mobile app marketing strategy. Analyzing and adjusting metrics constantly allows you to promptly react to changes in user behavior, deeply understanding their needs and wants – which is the ultimate key to any business success. Keeping track of the most important metrics, understanding how they work and how to improve them can be quite tricky at the beginning, yet it is mandatory to build up a profitable business. Remember, before diving into data and metrics you need to identify your goals and question yourself whether or not you need that specific metric. Metrics are meaningful only if related to a set goal – that’s all you need to keep in mind to turn them into your best allies.